The seafloor relief (bathymetry)
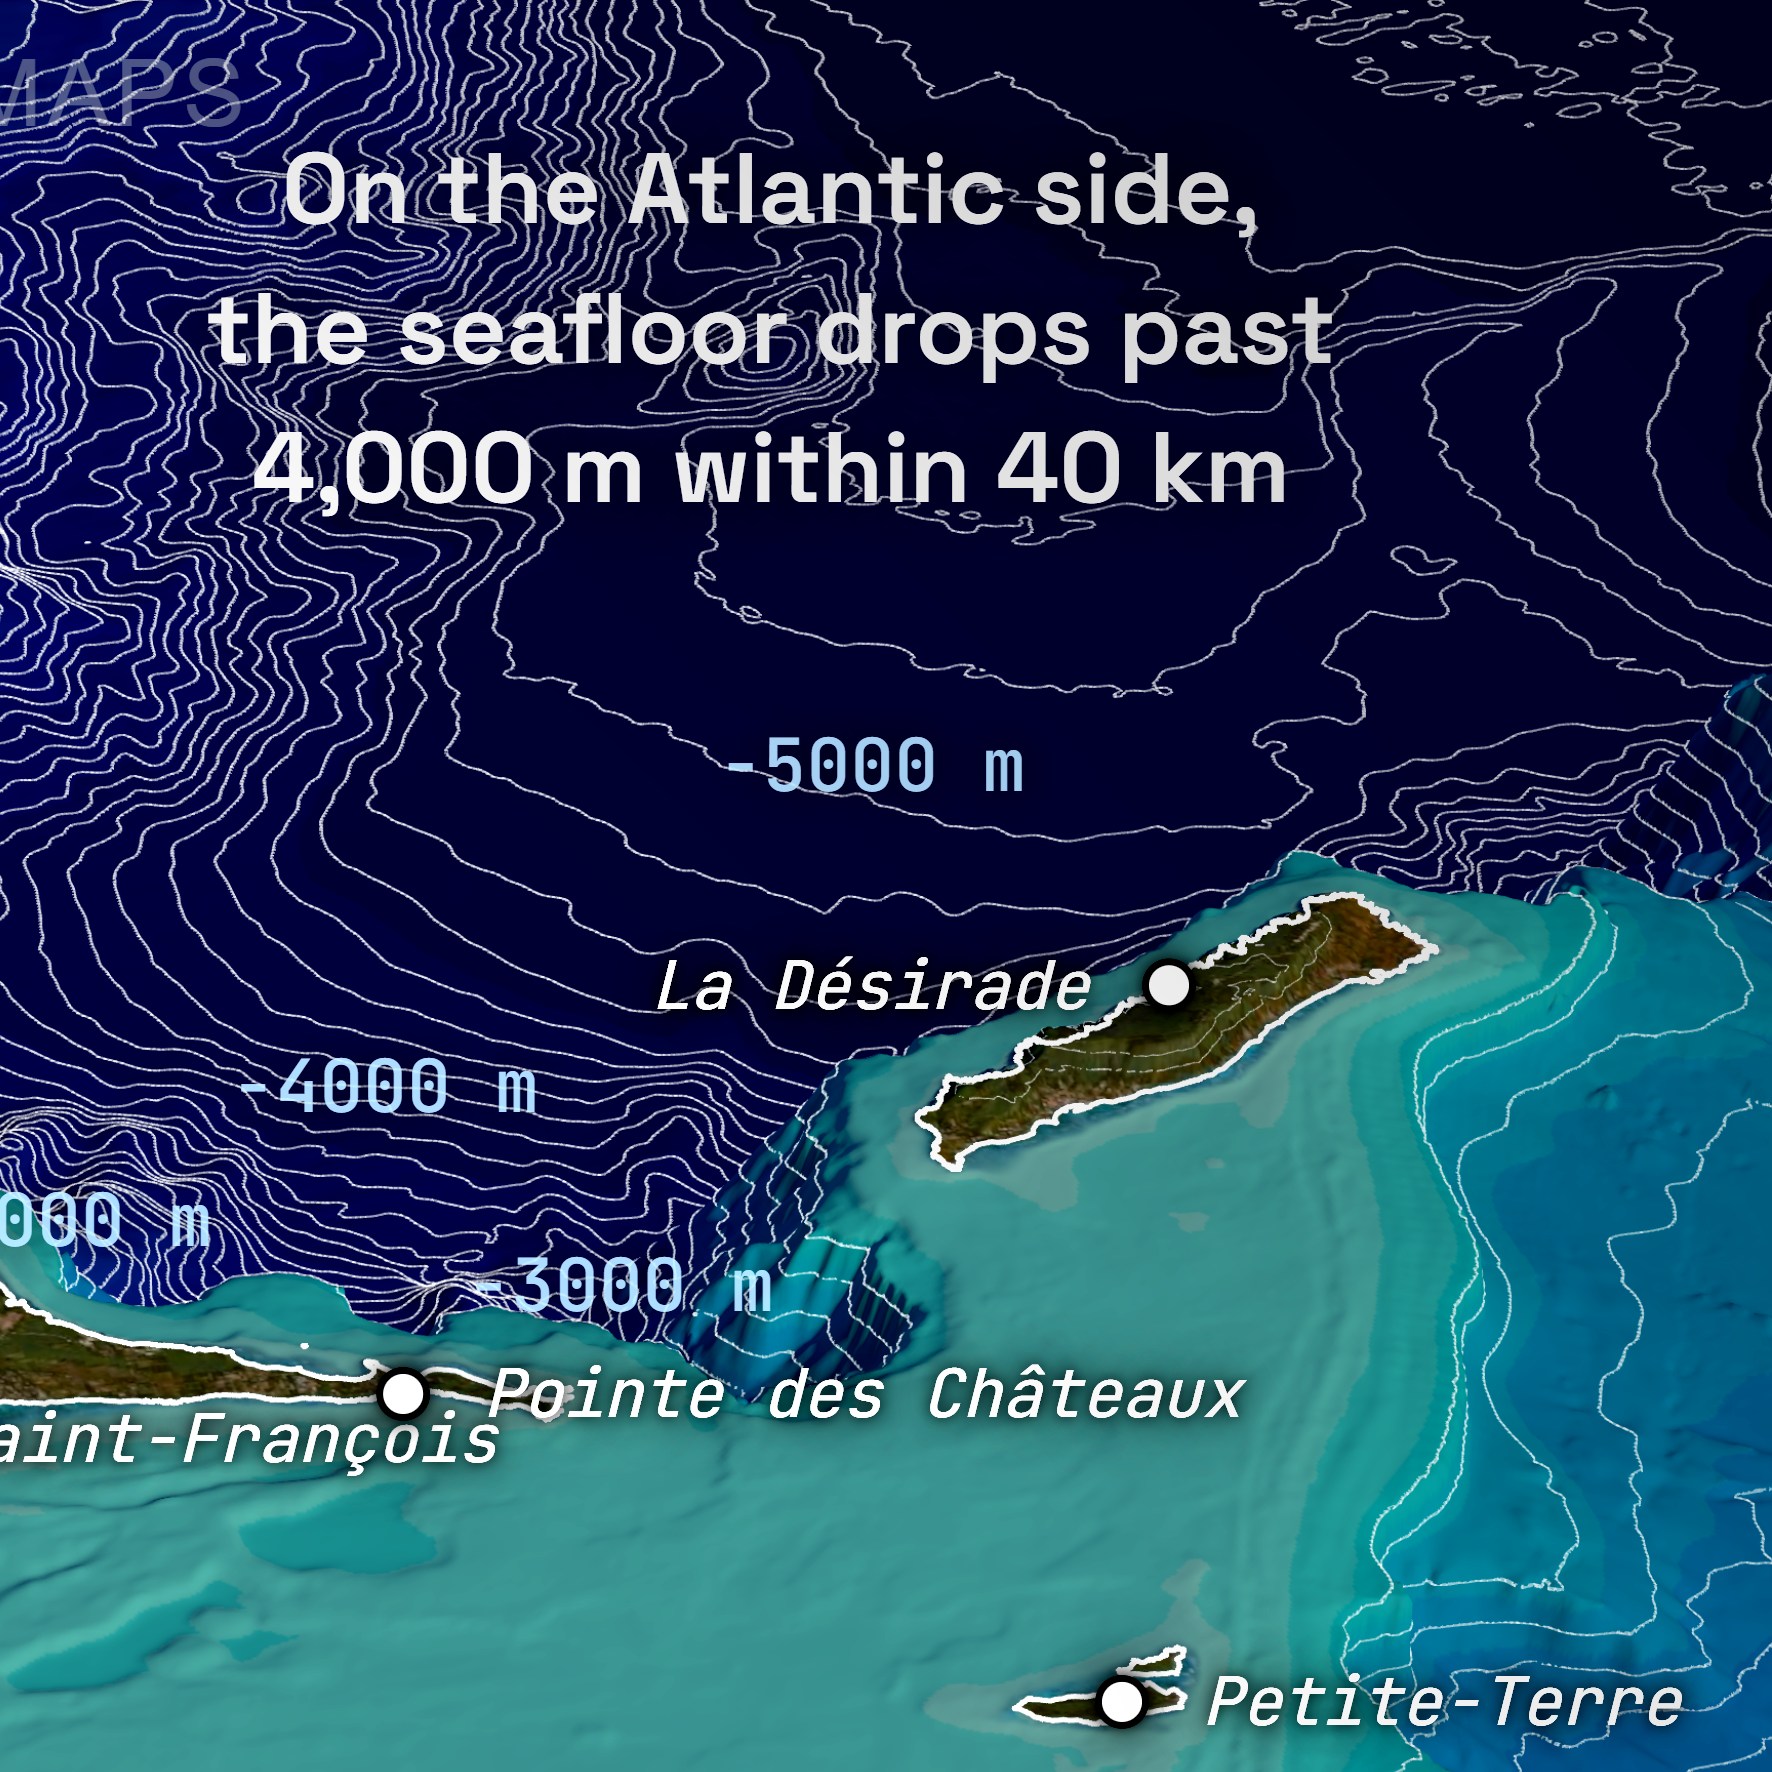
Every poster starts with bathymetric data — the measured depth of the seafloor, not an illustration. We pull it from open scientific datasets (national hydrographic surveys where they exist, global datasets elsewhere), mesh it into 3D terrain, and exaggerate the vertical scale so the shape that actually explains the island — a shelf, an escarpment, a volcanic cone — becomes readable at a glance. The color gradient encodes depth: darker blues sit deeper, the palette lightens toward the surface, and contour lines mark regular depth steps. This is the layer the whole series exists for: it's the part of the island nobody ever sees.
The island above the water
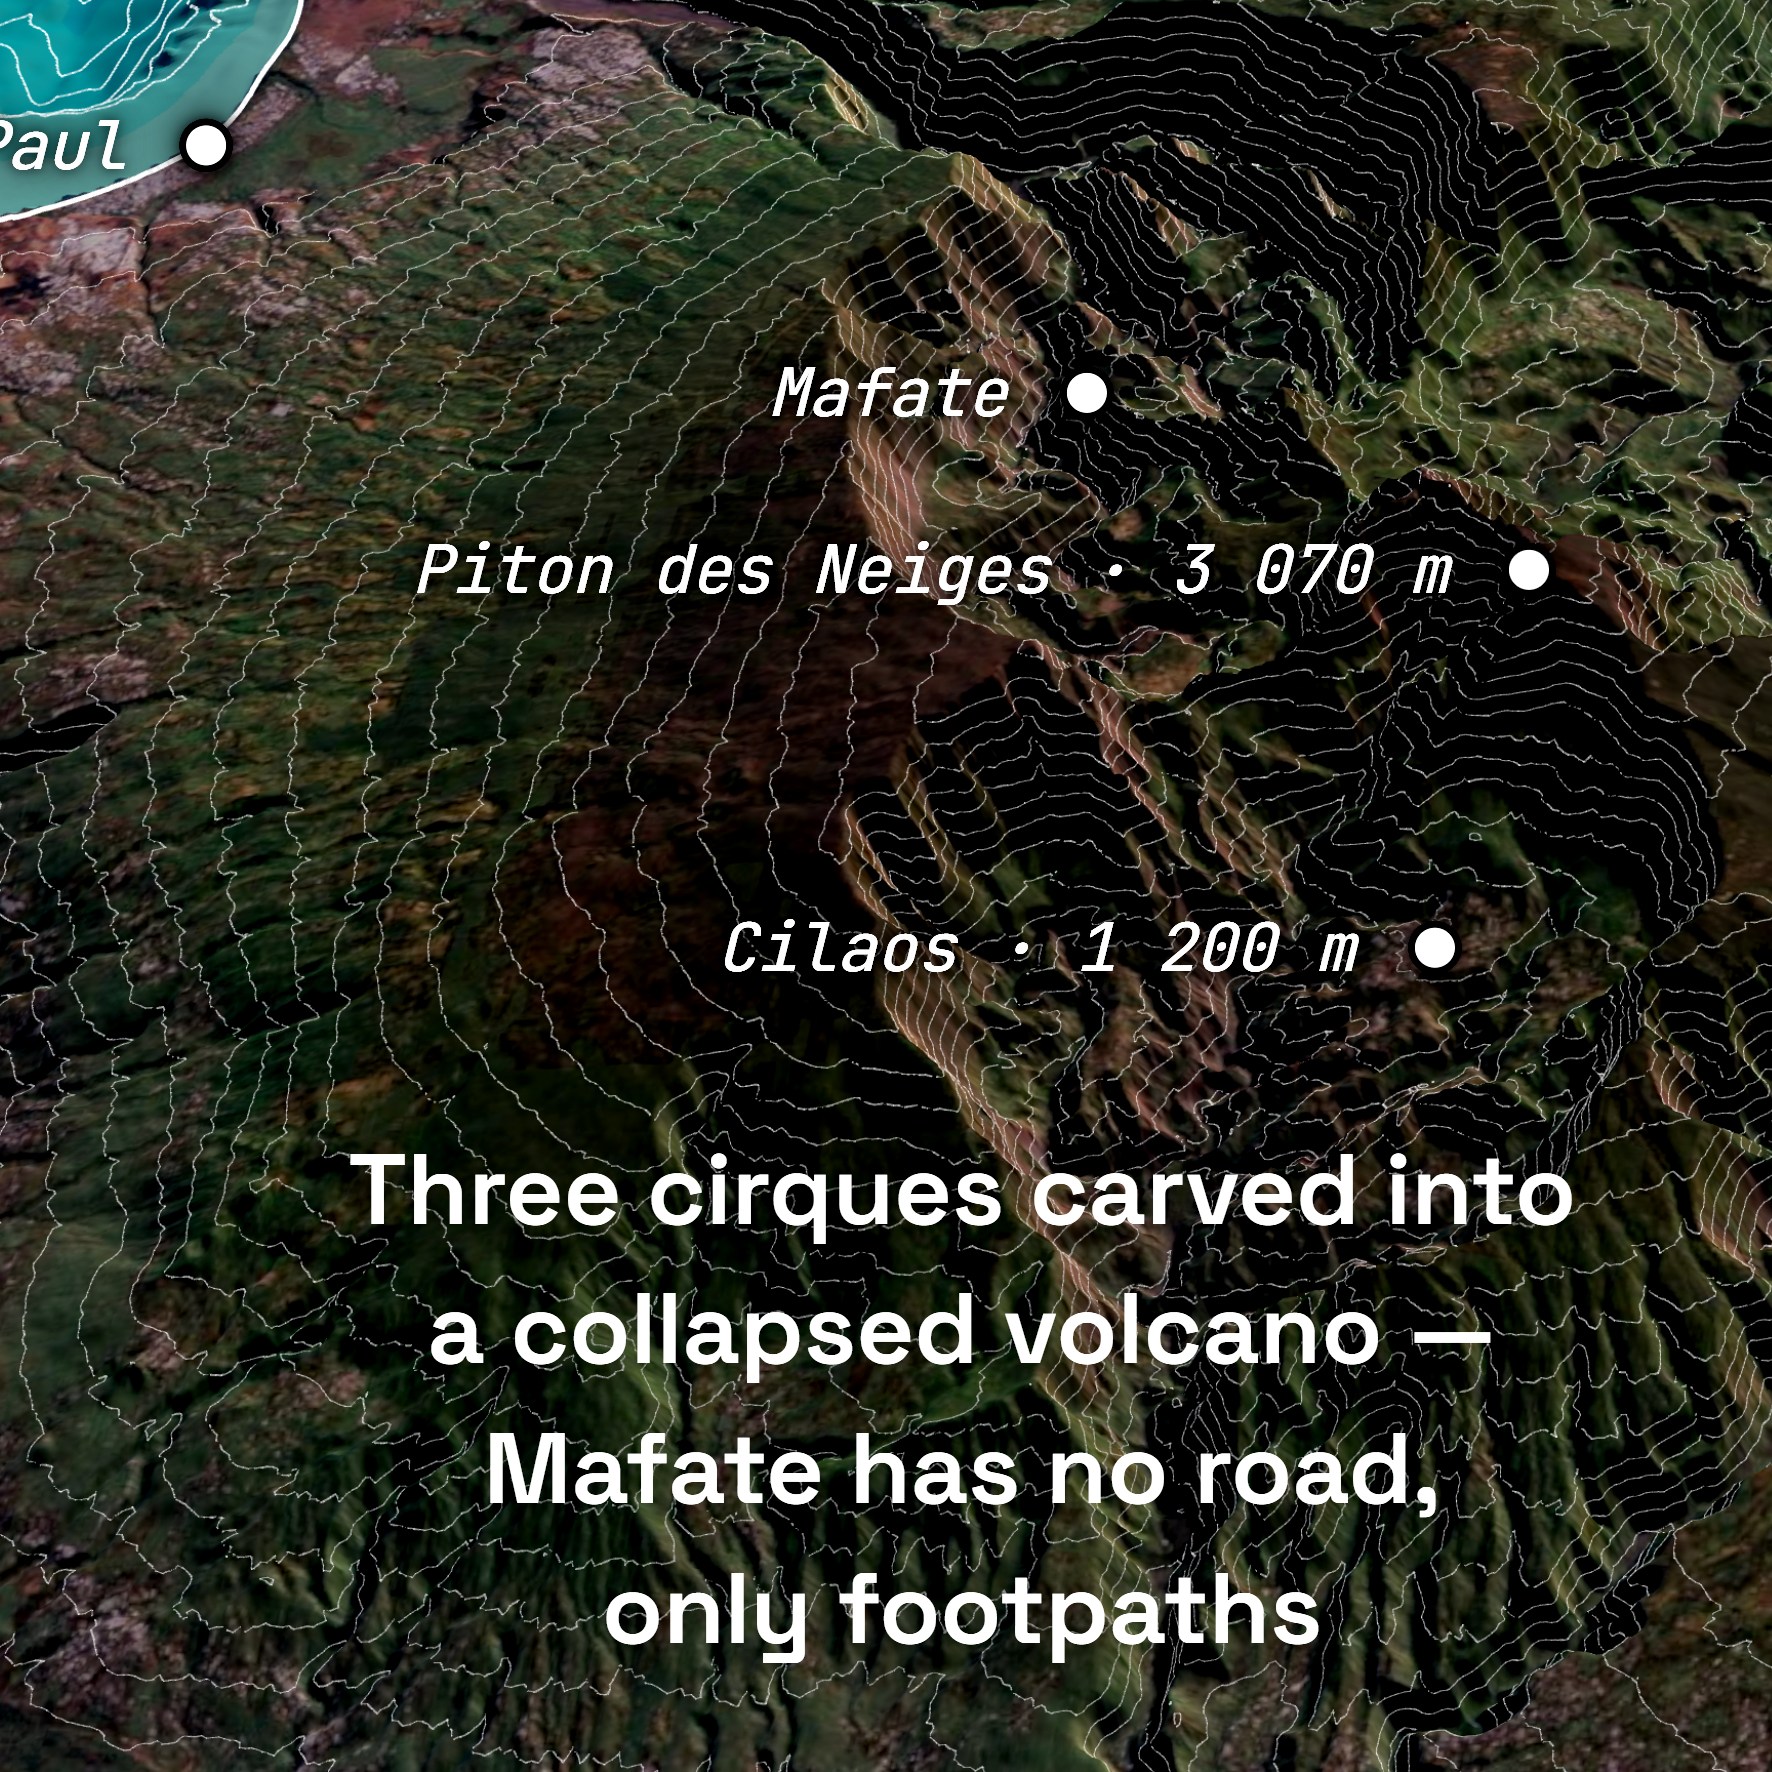
The land is measured too, from a separate open elevation dataset, and rendered from open satellite imagery — same treatment, same vertical scale, contour lines included. That continuity is the point of the series: on the print, nothing changes at the waterline. La Réunion's cone is about 7,000 m tall and only its top 3,070 m stand above the sea; Guadeloupe rises 5,737 m from the deepest point in its frame. You can only make that argument if both halves of the relief are drawn as one object.
The map itself
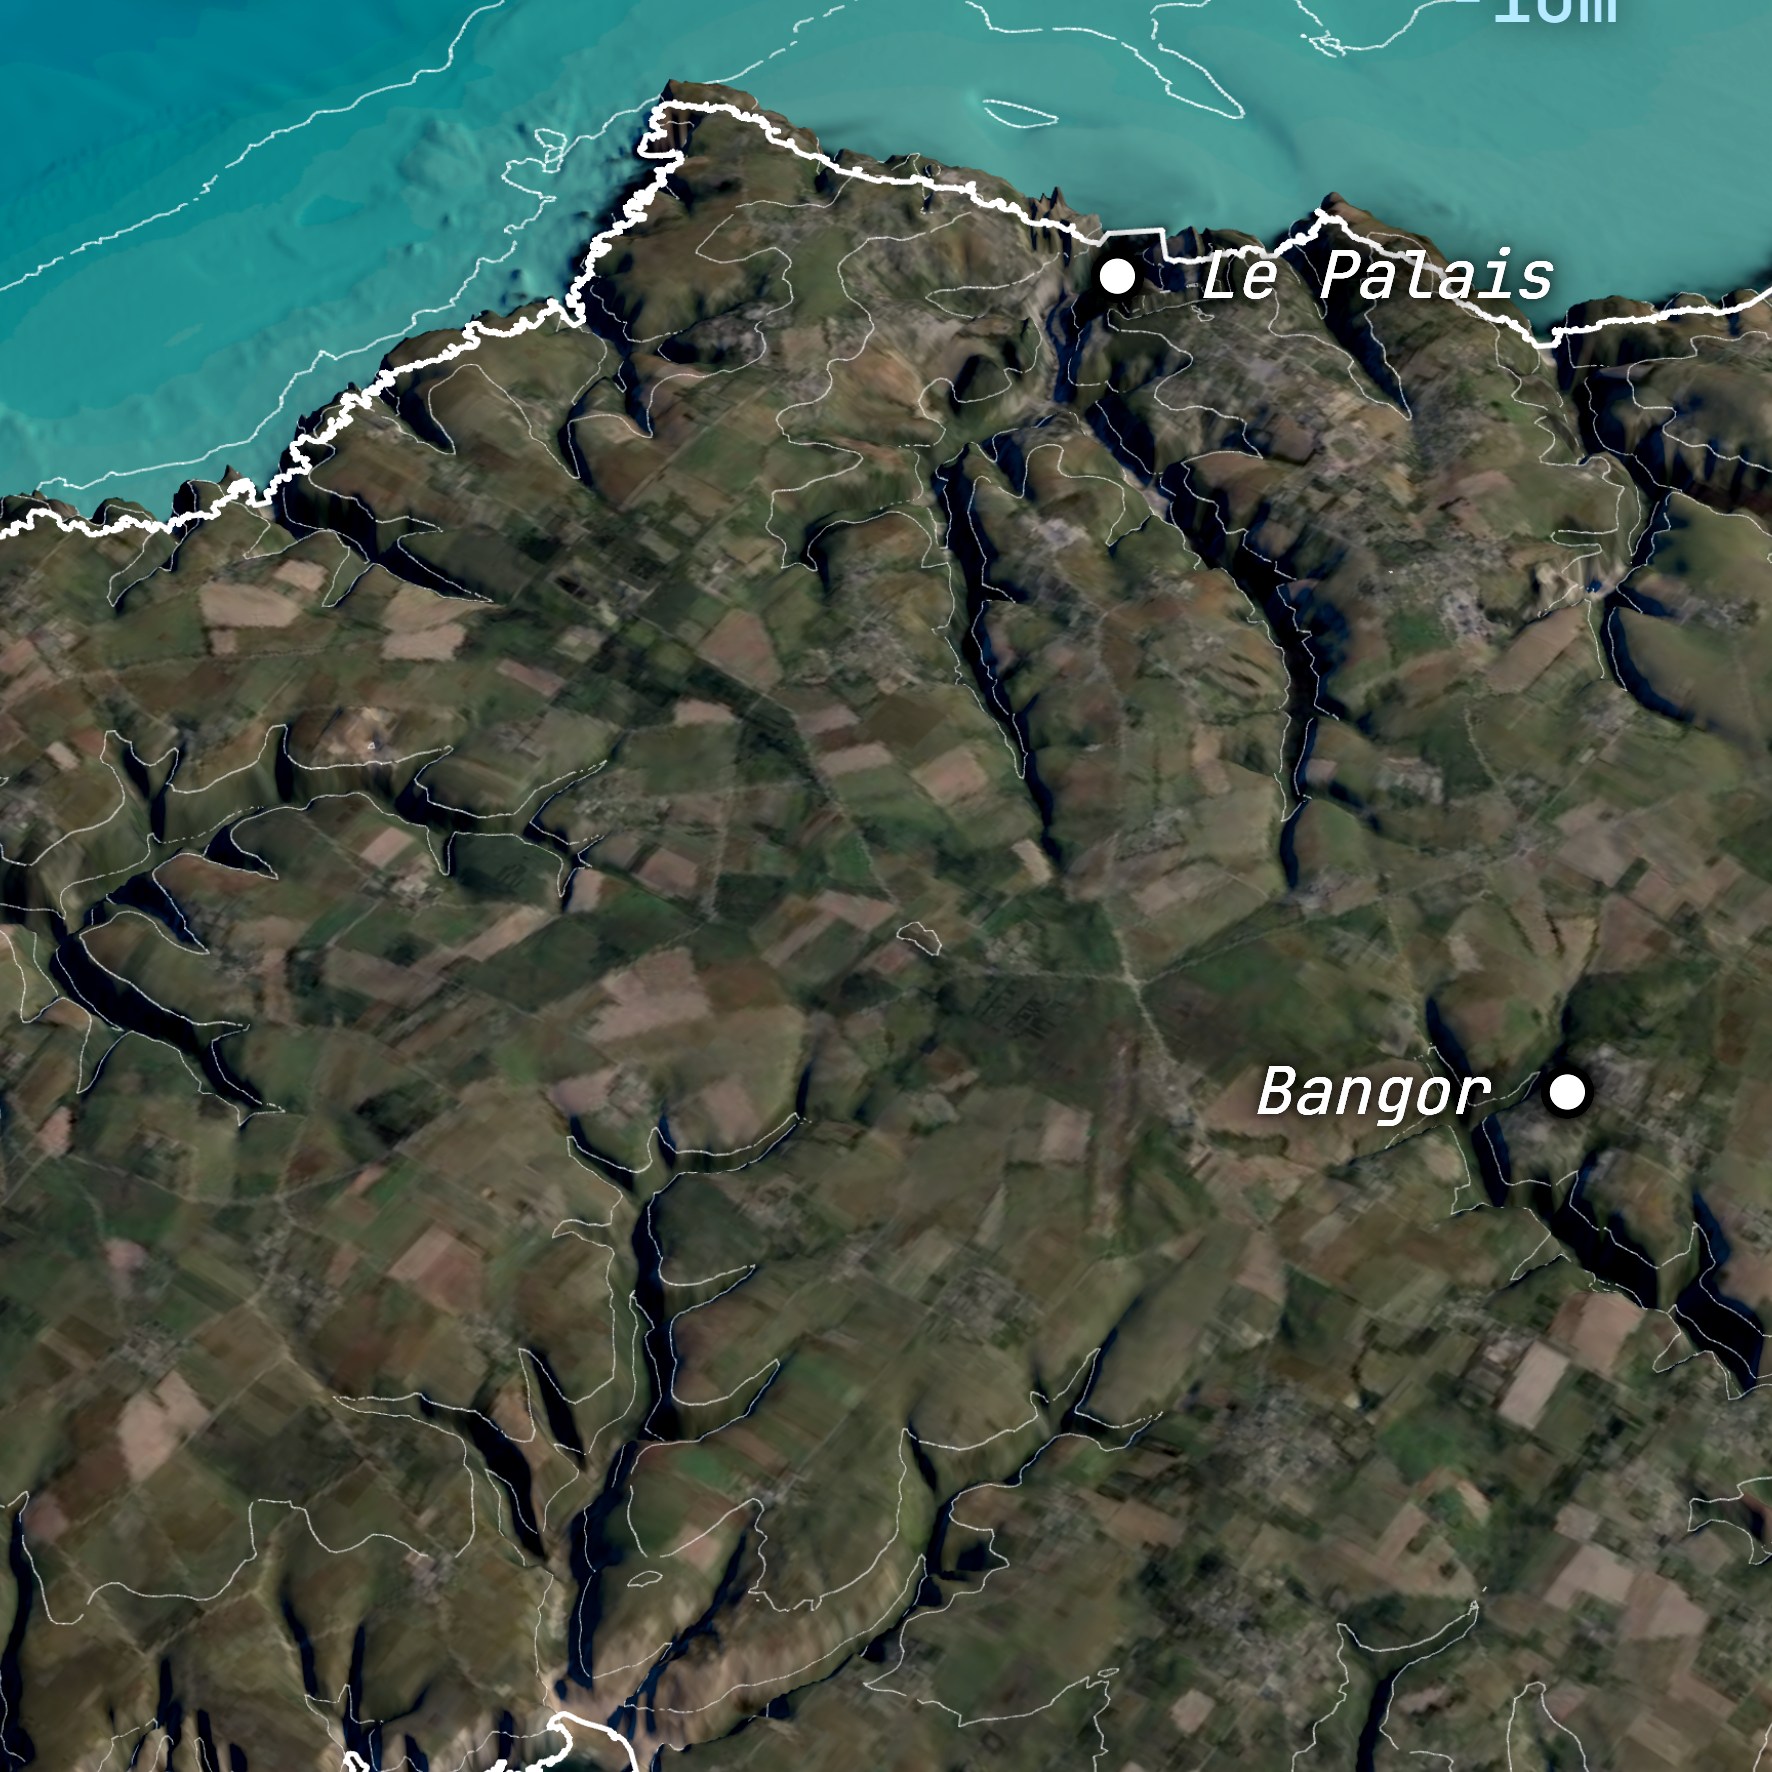
Everything that isn't relief is sourced map data too, not drawn by hand: the coastline tracing every headland and inlet, and the place names — towns, summits, capes — that give the island context. All of it comes from open map data, positioned from its real coordinates. Only the short annotations are written by us: a handful of sentences per poster, researched for that specific island and checked against more than one source before they earn a place on the print. Nothing on an HIR poster is a simulation or an artist's impression.
The legend
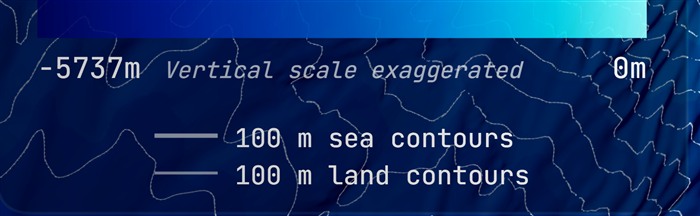
Every poster carries the same legend, bottom-left: the depth ramp, from the deepest point in the frame to sea level, a reminder that the vertical relief is exaggerated for readability, and the step between two contour lines — 100 m on Guadeloupe and La Réunion, 10 m on the shallow shelf around Belle-Île.
North and distance
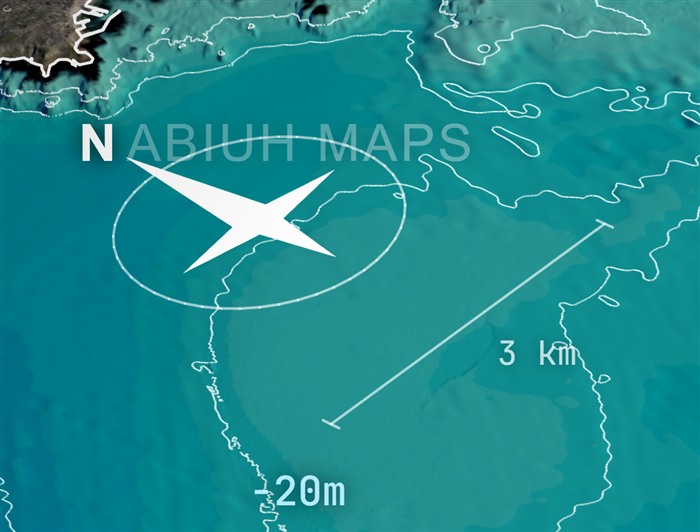
The view is oblique, not a flat map seen from above — that's what lets the relief read as relief. So each poster carries a compass rose pointing to true north for the camera it was rendered with, and a graphic scale bar giving the real ground distance. The bar is sized per island: 3 km across Belle-Île's 41 km frame, 10 km across Guadeloupe's 196 km one.
Credits

Bottom-right, every poster credits its own data: who surveyed the seafloor, where the land elevation and the imagery come from, and the map data behind coastline and place names. Nothing on the poster is uncredited, and every source is open data.
Under the hood
Each poster comes out of an in-house 3D engine that runs entirely in a web browser. A geospatial data-preparation and interactive-rendering pipeline turns open bathymetry, elevation, imagery and map data into a single model of the island you can pan, zoom, rotate and fine-tune in real time. The compass rose and the scale bar track the view live — the rose reorients to true north and tilts with the camera, and the bar always reads the real ground distance.
For the prints, that live scene is re-rendered off-screen at print resolution: 5906 × 5906 pixels, which is 50 × 50 cm at 300 dpi. Same engine, same data, turned from an interactive view into a poster-quality image.